
Fil:DK opinion polls 2011 election.png
Der findes ingen højere opløsning af billedet
DK_opinion_polls_2011_election.png (778 × 487 billedpunkter, filstørrelse: 9 KB, MIME-type: image/png)
|
|
Denne fil er fra Wikimedia Commons. Beskrivelsen af filen fra Commons er gengivet nedenfor. |
Beskrivelse
| Beskrivelse |
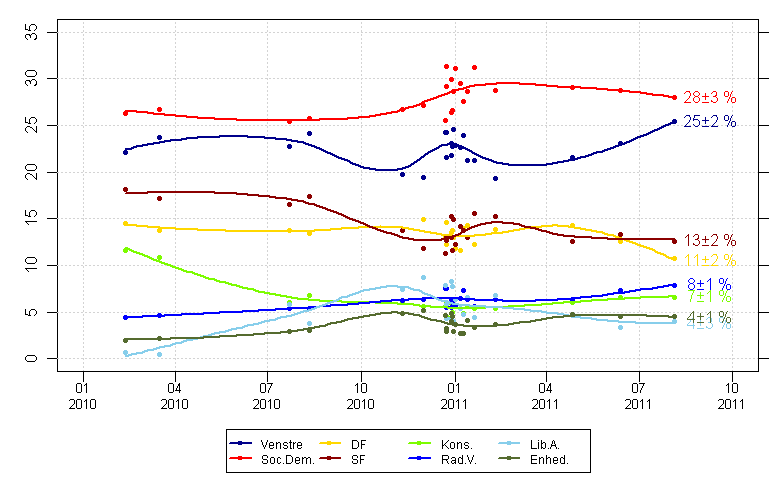
English: Graph showing support for political parties in Denmark since the start of 2010.Data is obtained from the Wikipedia page [1] |
| Dato | |
| Kilde | Eget arbejde |
| Forfatter | Mark Payne |
Figure is produced using the R statistical package, using the following code. It first reads the HTML directly from the website, then parses the data and saves the graph into your working directory. It should be able to be run directly by anyone with R.
rm(list=ls())

#Parameters
party.names <- c("Venstre","Soc.Dem.","DFP","SF","Kons.","Rad.V.","Lib.A.","Enhed.","KD")
parties.to.plot <- party.names[1:8]
party.cols    <- c("darkblue","red","gold","darkred","lawngreen","blue","darkolivegreen")
ylims <- c(0,35)
xlims <- c(ISOdate(2010,1,15),ISOdate(2011,10,15))
ticks <- ISOdate(rep(c(2010,2011),each=4),rep(c(1,4,7,10),times=2),15)

#Load the complete HTML file into memory
html <- readLines(url("http://en.wikipedia.org/wiki/Danish_parliamentary_election,_2011"),encoding="UTF-8")
closeAllConnections()

#Extract the opinion poll data table
tbl.no <- 6
tbl <- html[][tbl.no]):(grep("</table.*",html)[tbl.no])]

#Now split it into the rows, based on the <tr> tag
tbl.rows <- list()
open.tr <- grep("<tr",tbl)
close.tr <- grep("</tr",tbl)
for(i in 1:length(open.tr)) tbl.rows[[i]] <- tbl[][i]:close.tr[i]

#Throwout items that are headers or extra info
tbl.rows <- tbl.rows[sapply(tbl.rows,function(x) length(grep("<td",x)))>1]

#Now extract the data
survey.dat <- lapply(tbl.rows,function(x) {
  #Start by only considering where we have <td> tags
  td.tags <- x[grep("<td",x)]
  #Polling data appears in columns 3-10
  dat     <- td.tags[4:12]
  #Now strip the data and covert to numeric format
  dat     <- gsub("<td>|</td>","",dat)
  dat     <- gsub("<b>|</b>","",dat)
  dat     <- gsub("%","",dat)
  dat     <- gsub("-","0",dat)
  dat     <- as.numeric(dat)
  dat     <- ifelse(is.na(dat),0,dat)
  names(dat) <- party.names
  #Getting the date strings is a little harder. Start by tidying up the dates
  date.str <- td.tags[2]                        #Dates are in the second column
  date.str <- gsub("<td>|</td>","",date.str)  #Throw out any tags

  #And finally the survey time
  survey.time <- as.POSIXct(strptime(date.str,format="%Y-%m-%d"))
  #Get the name of the survey company too
  survey.comp <- td.tags[1]
  survey.comp <- gsub("<sup.*</sup>","",survey.comp)
  survey.comp <- gsub("<td>|</td>","",survey.comp)
  survey.comp <- gsub("<U+2013>","-",survey.comp,fixed=TRUE)
  survey.comp <- gsub("(?U)<.*>","",survey.comp,perl=TRUE)

  #And now return results
  return(data.frame(Company=survey.comp,Date=survey.time,date.str,t(dat)))
})

#Combine results
surveys <- do.call(rbind,survey.dat)

#Subset data to only plot selected parties in time window
polls   <- surveys[,c("Company","Date",parties.to.plot)]
polls <- subset(polls,!is.na(polls$Date) )
polls <- subset(polls,polls$Date>=min(xlims) )
polls <- polls[order(polls$Date),]
polls$date.num  <- as.double(polls$Date)

#Setup plot
png("DK_opinion_polls_2011_election.png",width=778,height=487,pointsize=16)
par(mar=c(3,4,1,1),oma=c(3,0,0,0))
matplot(polls$date.num,polls[,parties.to.plot],pch=NA,xlim=xlims,ylab="Party support (%)",xlab="",
  col=party.cols,xaxt="n",ylim=ylims)
abline(h=seq(0,95,by=5),col="lightgrey",lty=3)
abline(v=as.double(ticks),col="lightgrey",lty=3)
axis(1,at=as.double(ticks),labels=format(ticks,format="%b\n%Y"),cex.axis=0.8)
axis(4,at=axTicks(4),labels=rep("",length(axTicks(4))))

#Now calculate the loess smoothers and add the confidence interval
smoothed <- list()
predict.x <- seq(min(polls$date.num),max(polls$date.num),length.out=100)
for(i in 1:length(parties.to.plot)) {
  smoother <- loess(polls[][i] ~ polls[,"date.num"],span=0.75)
  smoothed[[i]] <- predict(smoother,newdata=predict.x,se=TRUE)
#  polygon(c(predict.x,rev(predict.x)),
#    c(smoothed[[i]]$fit+smoothed[[i]]$se.fit*1.96,rev(smoothed[[i]]$fit-smoothed[[i]]$se.fit*1.96)),
#    col=rgb(0.5,0.5,0.5,0.5),border=NA)
}
names(smoothed) <- parties.to.plot
#Then add the data points
matpoints(polls$date.num,polls[,parties.to.plot],pch=20,col=party.cols)
#And finally the smoothers themselves
for(i in 1:length(parties.to.plot)) {
  lines(predict.x,smoothed[[i]]$fit,col=party.cols[i],lwd=2)
}

legend(grconvertX(0.5,"npc"),grconvertY(0,"nfc"),legend=parties.to.plot,col=party.cols,
    pch=20,bg="white",lwd=2,ncol=ceiling(length(parties.to.plot)/2),cex=0.75,xpd=NA,xjust=0.5)

#Add best estimates
for(i in 1:length(smoothed)) {
  lbl <- sprintf("%2.0f ± %1.0f",round(rev(smoothed[[i]]$fit)[1],0),round(1.96*rev(smoothed[[i]]$se.fit)[1],0))
  text(rev(polls$date.num)[1],rev(smoothed[[i]]$fit)[1],labels=lbl,pos=4,col=party.cols[i])
}
dev.off()
Licensering
Jeg, dette værks ophavsretsindehaver, publicerer hermed værket under den følgende licens:
Denne fil er udgivet under Creative Commons Kreditering-Del på samme vilkår 3.0 Ikke-porteret-licensen.
- Du må frit:
- at dele – at kopiere, distribuere og overføre værket
- at remixe – at tilpasse værket
- Under følgende vilkår:
- kreditering – Du skal give passende kreditering, angive et link til licensen, og oplyse om der er foretaget ændringer. Du må gøre det på enhver fornuftig måde, men ikke på en måde der antyder at licensgiveren godkender dig eller din anvendelse.
- deling på samme vilkår – Hvis du bearbejder, ændrer eller bygger videre på dette værk, skal du distribuere dine bidrag under den samme eller en kompatibel licens som originalen.
Filhistorik
Klik på en dato/tid for at se filen som den så ud på det tidspunkt.
| Dato/tid | Miniaturebillede | Dimensioner | Bruger | Kommentar | |
|---|---|---|---|---|---|
| nuværende | 22. aug. 2011, 21:59 | | 778 × 487 (9 KB) | Trevva | Updated to include latest results |
| 2. mar. 2011, 11:16 |  | 778 × 487 (8 KB) | Trevva | Fixed error with colours of the various parties | |
| 2. mar. 2011, 11:00 |  | 778 × 487 (8 KB) | Trevva | Updated figure to include 24 February polls. Corrected abbreviation for Dansk Folksparti to DF | |
| 17. feb. 2011, 15:49 |  | 778 × 487 (8 KB) | Trevva | Added % symbols | |
| 17. feb. 2011, 15:40 |  | 778 × 487 (8 KB) | Trevva | Internationalised figure, so that it is does not contain any english or danish. | |
| 17. feb. 2011, 14:53 |  | 778 × 487 (8 KB) | Trevva | {{Information |Description ={{en|1=Graph showing support for political parties in Denmark since the start of 2010.Data is obtained from the Wikipedia page http://en.wikipedia.org/wiki/Danish_parliamentary_election,_2011}} |Source =Own work |
Filanvendelse
Der er ingen sider der bruger denne fil.
Global filanvendelse
Følgende andre wikier anvender denne fil:
- Anvendelser på en.wikibooks.org
- Anvendelser på fi.wikipedia.org