
Fil:South Africa 2011 dominant language map.svg

Size of this PNG preview of this SVG file: 684 × 599 pixels. Andre opløsninger: 274 × 240 pixels | 548 × 480 pixels | 876 × 768 pixels | 1.168 × 1.024 pixels | 2.337 × 2.048 pixels | 809 × 709 pixels.
Fuld opløsning (SVG fil, basisstørrelse 809 × 709 pixels, filstørrelse: 798 KB)
|
|
Denne fil er fra Wikimedia Commons. Beskrivelsen af filen fra Commons er gengivet nedenfor. |
Beskrivelse
| Beskrivelse |
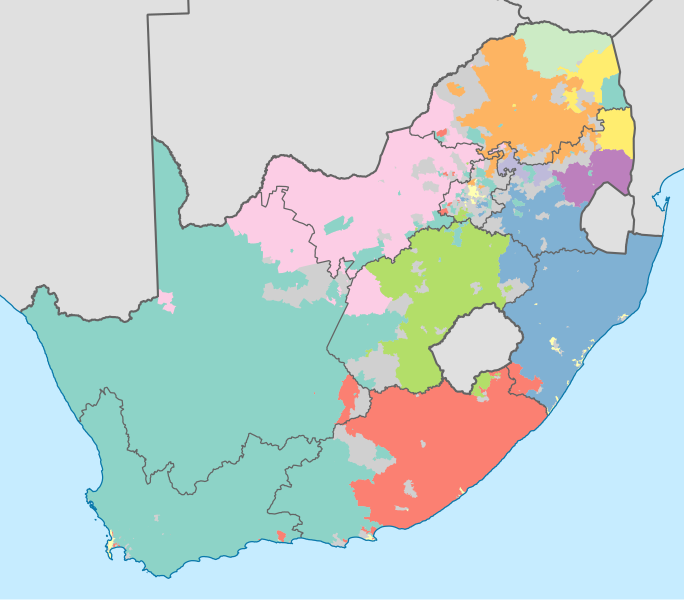
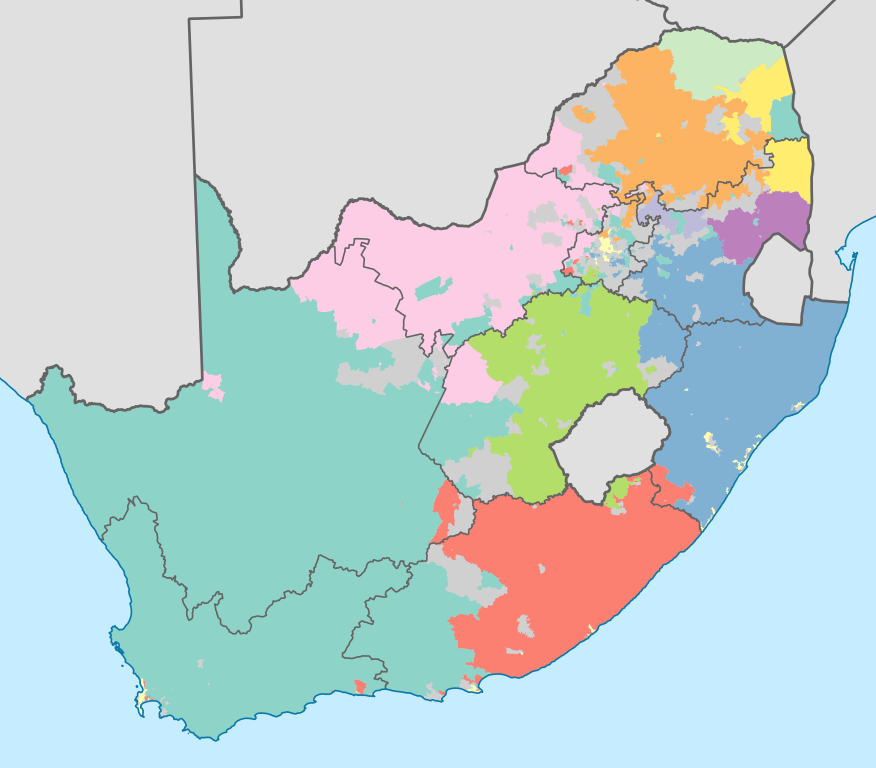
English: Map showing the dominant home languages in South Africa, based on ward-level data from the 2011 census. In this context, a language is dominant if it more than 50% of the population in a ward speak it at home, or more than 33% speak it and no other language is spoken by more than 25%.
English
Afrikaans
isiNdebele
isiXhosa
isiZulu
Sesotho sa Leboa
Sesotho
Setswana
siSwati
Tshivenda
Xitsonga
No language dominant
Projection is Albers Equal-Area Conic, with standard parallels at 25.5° S and 31.5° S, and origin at 28.5° S 24.5° E. |
| Dato | |
| Kilde | Statistics South Africa's Census 2011 is the source of the basic population data. The map results from my own processing of the data. For ward boundaries see File:South Africa electoral wards 2011 blank.svg. |
| Forfatter | Htonl |
| Andre versioner |
South Africa 2011 dominant language map (hex cells).svg: .svg) |
Licensering
The following license applies to the population data on which the map is based:

|
Indehaveren af ophavsretten til denne fil, Stats SA, tillader enhver at bruge filen til ethvert formål, under betingelse af, at rettighedshaveren krediteres som påkrævet. Videredistribution, afledte værker, kommerciel brug og alle andre formål tillades. |
Kreditering:
"the user acknowledges Stats SA as the source of the basic data wherever they process, apply, utilise, publish or distribute the data, and also that they specify that the relevant application and analysis (where applicable) result from their own processing of the data" [1]
|
The following tag applies to the map itself:
| Jeg, indehaveren af ophavsretten til dette værk, udgiver dette værk som offentlig ejendom. Dette gælder i hele verden. I nogle lande er dette ikke juridisk muligt. I så fald: Jeg giver enhver ret til at anvende dette værk til ethvert formål, uden nogen restriktioner, medmindre sådanne restriktioner er påkrævede ved lov. |
Filhistorik
Klik på en dato/tid for at se filen som den så ud på det tidspunkt.
| Dato/tid | Miniaturebillede | Dimensioner | Bruger | Kommentar | |
|---|---|---|---|---|---|
| nuværende | 18. nov. 2012, 23:09 | | 809 × 709 (798 KB) | Htonl | =={{int:filedesc}}== {{Information |Description={{en|1=Map showing the dominant home languages in South Africa, based on ward-level data from the 2011 census. In this context, a language is dominant if it more than 50% of the population in a ward speak... |
Filanvendelse
Der er ingen sider der bruger denne fil.
Global filanvendelse
Følgende andre wikier anvender denne fil:
- Anvendelser på af.wikipedia.org
- Anvendelser på cs.wikipedia.org
- Anvendelser på de.wikipedia.org
- Anvendelser på dsb.wikipedia.org
- Anvendelser på en.wikipedia.org
- Anvendelser på eo.wikipedia.org
- Anvendelser på frr.wikipedia.org
- Anvendelser på fr.wikipedia.org
- Anvendelser på fr.wiktionary.org
- Anvendelser på he.wikipedia.org
- Anvendelser på it.wikipedia.org
- Anvendelser på ka.wikipedia.org
- Anvendelser på ko.wikipedia.org
- Anvendelser på lb.wikipedia.org
- Anvendelser på ml.wikipedia.org
- Anvendelser på mzn.wikipedia.org
- Anvendelser på no.wikipedia.org
- Anvendelser på pt.wikipedia.org
- Anvendelser på rm.wikipedia.org
- Anvendelser på ro.wikipedia.org
- Anvendelser på ru.wikipedia.org
- Anvendelser på sh.wikipedia.org
- Anvendelser på simple.wikipedia.org
- Anvendelser på sr.wikipedia.org
- Anvendelser på ss.wikipedia.org
- Anvendelser på sv.wikipedia.org
- Anvendelser på sw.wikipedia.org
- Anvendelser på szl.wikipedia.org
- Anvendelser på te.wikipedia.org
- Anvendelser på tg.wikipedia.org
- Anvendelser på tr.wikipedia.org
- Anvendelser på uk.wikipedia.org
- Anvendelser på xh.wikipedia.org
- Anvendelser på zh.wikipedia.org
- Anvendelser på zu.wikipedia.org