
Fil:COVID-19 Outbreak World Map per Capita.svg

Fuld opløsning (SVG fil, basisstørrelse 2.921 × 1.500 pixels, filstørrelse: 2,78 MB)
|
|
Denne fil er fra Wikimedia Commons. Beskrivelsen af filen fra Commons er gengivet nedenfor. |

|
This file may be updated to reflect new information. If you wish to use a specific version of the file without new updates being mirrored, please upload the required version as a separate file. |
Beskrivelse
| Beskrivelse |
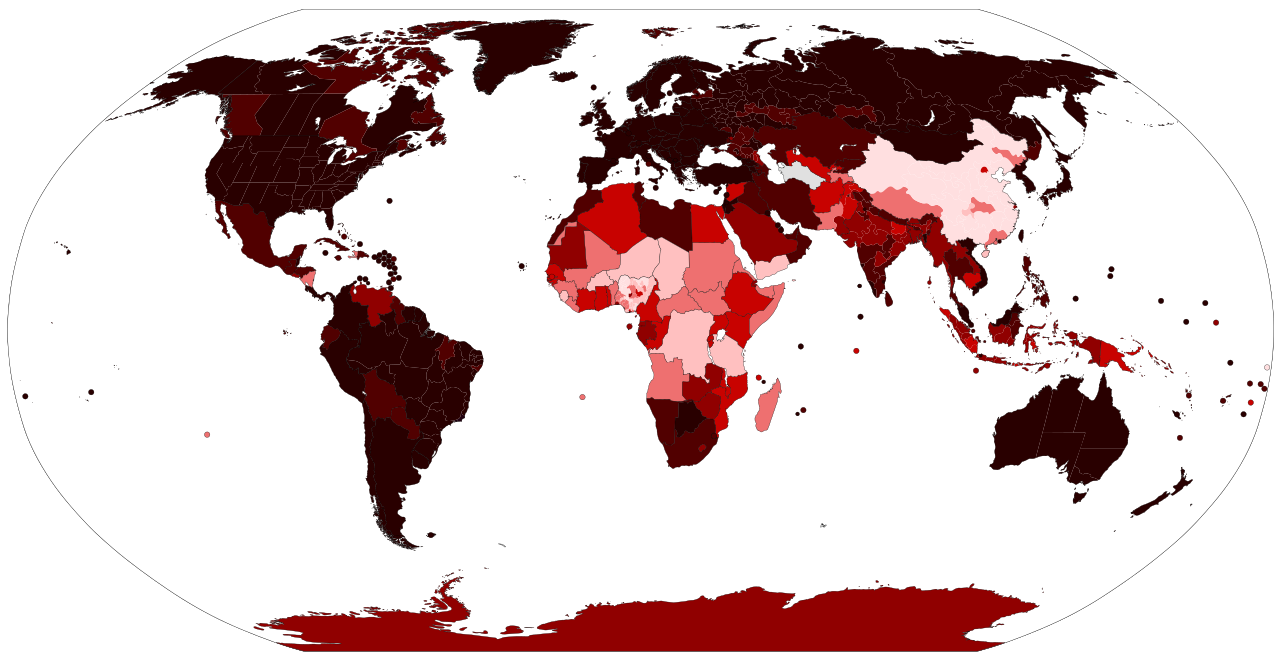
Deutsch: Häufigkeit der gemeldeten Corona-Infektionen / pro 1000 Einwohner English: Map of the COVID-19 verified number of infected per capita as of . In the latest versions of the map there is a color bar legend. See the file history farther down for the latest upload date from the source. Español: Mapa del número verificado de infectados per cápita por la COVID-19 al . > 100 casos por 1.000 habitantes 30 – 100 casos por 1.000 habitantes 10 – 30 casos por 1.000 habitantes 3 – 10 casos por 1.000 habitantes 1 – 3 casos por 1.000 habitantes 0.3 – 1 casos por 1.000 habitantes > 0 – 0.3 casos por 1.000 habitantes No hay casos notificados, no hay población o no hay datos disponibles Français : Carte du nombre vérifié de cas d’infection à la covid-19 par habitant au . Português: Mapa do número de casos verificados de infectados pela COVID-19 per capita em . Русский: Карта количества подтверждённых случаев заражения COVID-19 на душу населения по состоянию на .y Українська: Карта підтвердженого числа інфікованих COVID-19 на душу населення станом на . 中文: 經驗證的各國感染人均COVID-19病例地圖,資料於更新。 Since this is a rapidly evolving situation, new cases may not be immediately represented visually. Refer to the primary article COVID-19 pandemic or the World Health Organization's situation reports for most recent reported case information. Legend information for older versions: Every country larger than 3 million km² or with a bigger population than 200 million people has been split up into its first level administrative division for better visualization of the spread of the epidemic. > 100 cases per 1,000 inhabitants 30 – 100 cases per 1,000 inhabitants 10 – 30 cases per 1,000 inhabitants 3 – 10 cases per 1,000 inhabitants 1 – 3 cases per 1,000 inhabitants 0.3 – 1 cases per 1,000 inhabitants > 0 – 0.3 cases per 1,000 inhabitants No reported cases, no population, or no data available |
| Dato |
17. marts 2020 (First version). Date of first upload to the Wikimedia Commons. An upload link is at the end of the file history list. Please upload new versions at least once per week. Update the "point in time" date in the Wikidata entry linked below. {{wikidata|property|Q95963597|P585}} is used in map captions on Wikipedia. It provides the map date. To enable the date change click the purge link after updating the Wikidata entry. |
| Kilde |
Latest versions: https://ourworldindata.org/explorers/coronavirus-data-explorer?tab=map&Metric=Confirmed+cases&Interval=Cumulative&Relative+to+Population=true&Align+outbreaks=false&country=~OWID_WRL - Our World in Data. Click on the download tab to download map. The table tab has a table of the exact data by country. Source tab says data is from the COVID-19 Data Repository by the Center for Systems Science and Engineering (CSSE) at Johns Hopkins University. The map at the source is interactive and provides more detail. For example, run your cursor over the color bar legend to see the countries that apply to that point in the legend. Older versions: Eget arbejde
|
| Forfatter | Raphaël Dunant, Gajmar (maintainer),幺于 (maintainer) |
| SVG udvikling | Vektorgrafikken blev lavet med unknown tool. |
Licensering
- Du må frit:
- at dele – at kopiere, distribuere og overføre værket
- at remixe – at tilpasse værket
- Under følgende vilkår:
- kreditering – Du skal give passende kreditering, angive et link til licensen, og oplyse om der er foretaget ændringer. Du må gøre det på enhver fornuftig måde, men ikke på en måde der antyder at licensgiveren godkender dig eller din anvendelse.
Filhistorik
Klik på en dato/tid for at se filen som den så ud på det tidspunkt.
| Dato/tid | Miniaturebillede | Dimensioner | Bruger | Kommentar | |
|---|---|---|---|---|---|
| nuværende | 24. dec. 2022, 07:54 | | 2.921 × 1.500 (2,78 MB) | AKS471883 | update |
| 7. dec. 2022, 05:34 |  | 2.921 × 1.500 (2,78 MB) | AKS471883 | update | |
| 20. nov. 2022, 09:58 |  | 2.921 × 1.500 (2,78 MB) | AKS471883 | update | |
| 31. aug. 2022, 09:54 |  | 2.921 × 1.500 (2,78 MB) | AKS471883 | update | |
| 30. aug. 2022, 09:40 |  | 2.921 × 1.500 (2,78 MB) | 幺于 | update | |
| 27. jun. 2022, 09:42 |  | 2.921 × 1.500 (2,78 MB) | 幺于 | update | |
| 22. maj 2022, 05:36 |  | 2.921 × 1.500 (2,78 MB) | 幺于 | update | |
| 22. maj 2022, 04:52 |  | 2.921 × 1.500 (2,78 MB) | AKS471883 | Update | |
| 21. maj 2022, 14:38 |  | 2.921 × 1.500 (2,78 MB) | AKS471883 | update | |
| 19. maj 2022, 12:51 |  | 2.921 × 1.500 (2,78 MB) | AKS471883 | Easter Island to Chile |
Filanvendelse
Der er ingen sider der bruger denne fil.
Global filanvendelse
Følgende andre wikier anvender denne fil:
- Anvendelser på af.wikipedia.org
- Anvendelser på ar.wikipedia.org
- Anvendelser på arz.wikipedia.org
- Anvendelser på ast.wikipedia.org
- Anvendelser på as.wikipedia.org
- Anvendelser på awa.wikipedia.org
- Anvendelser på azb.wikipedia.org
- Anvendelser på az.wikipedia.org
- Anvendelser på bg.wikipedia.org
- Anvendelser på bjn.wikipedia.org
- Anvendelser på bn.wikipedia.org
- Anvendelser på bo.wikipedia.org
- Anvendelser på br.wikipedia.org
- Anvendelser på ca.wikipedia.org
- Anvendelser på cs.wikipedia.org
- Anvendelser på dag.wikipedia.org
- Anvendelser på de.wikipedia.org
- Benutzer:Mapmaster
- COVID-19-Pandemie
- COVID-19-Pandemie in Italien
- COVID-19-Pandemie in Deutschland
- COVID-19-Pandemie in Südkorea
- COVID-19-Pandemie in der Schweiz
- COVID-19-Pandemie in Österreich
- Vorlage:Navigationsleiste COVID-19-Pandemie
- COVID-19-Pandemie in Frankreich
- COVID-19-Pandemie im Iran
- COVID-19-Pandemie in den Vereinigten Staaten
- COVID-19-Pandemie in der Volksrepublik China
- COVID-19-Pandemie in Spanien
- COVID-19-Pandemie in Osttimor
- COVID-19-Pandemie in Norwegen
- COVID-19-Pandemie in Afrika
- COVID-19-Pandemie in Dänemark
- COVID-19-Pandemie in Japan
- COVID-19-Pandemie in Finnland
- COVID-19-Pandemie in Polen
- COVID-19-Pandemie im Königreich der Niederlande
- COVID-19-Pandemie in Vietnam
- COVID-19-Pandemie in San Marino
- COVID-19-Pandemie im Vereinigten Königreich
- COVID-19-Pandemie in Belgien
- COVID-19-Pandemie in Israel
- COVID-19-Pandemie in Liechtenstein
- COVID-19-Pandemie in Indien
- COVID-19-Pandemie in Kanada
- COVID-19-Pandemie in Brasilien
- COVID-19-Pandemie in Portugal
- Benutzer:Triplec85/COVID-19-Pandemie in
Vis flere globale anvendelser af denne fil.